Skill development has come into the fore in recent years with renewed gusto in the face of a severe skills shortage and low employability figures. What role do skill development indicators play?
Building skills is an expensive affair central to which is good data on various metrics or indicators that are integral to where skill development is most required, labour market conditions, local and state-wise factors affecting employment and skilling, and crucially, how are returns on investment in mass skilling programmes measured?
It is estimated that of the 12-15 million youth entering the Indian workforce every year, just about 45.6 percent of them are employable.[i] A serious cause for alarm is that 58.3 percent of unemployed graduates cited non-availability of jobs matching with education, skill and experience as the chief reason for unemployment.[ii] A National Skill Development Mission was approved by the Union Cabinet in 2015. The Mission simply stated, is to achieve the vision of a ‘Skilled India’ through a consolidated and streamlined process across states and sectors. But is that happening?
For regular updates and content on Apprenticeships, follow us on
![]()
![]()
Enter Skill Indicators
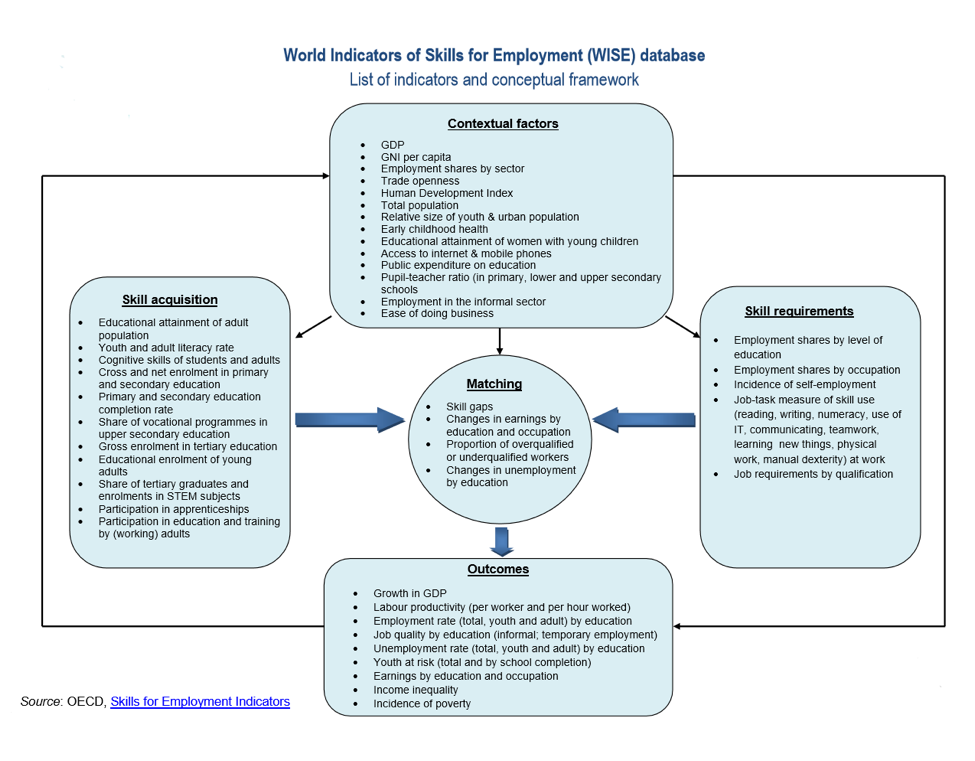
Just as skills are an important measure of productivity of a workforce, skill indicators or key metrics related to skilling should form the bedrock of how mass skilling programmes are rolled out. These are real-time data on regional, state/city/area and national metrics that affect skilling. In 2010, the G20 proposed the establishment of a set of internationally comparable indicators of skills for employment and productivity. In response the OECD formed the World Indicators of Skills for Employment (WISE) database in partnership with the World Bank, ILO, ETF and UNESCO. The purpose of the WISE database is to serve as a complete go-to resource that can provide an up-to-date statistical snapshot of a country’s economic and social metrics that impact skilling; such as cross-sectoral data and statistics for education, employment, training, vocational skills, gender, wage etc. The objective is to enable countries to evaluate their skilling landscapes and shape strategies based on robust data. The WISE database currently covers over 200 countries with 60 internationally comparable skill development indicators.[iii]
The conceptual framework of the WISE database comprises of skill indicators across 5 domains:[iv]
- Contextual factors– driving supply of skills
- Skill acquisition– driving demand for skills
- Skill requirements– factors impacting skills and jobs match i.e. how well are skills obtained through education and training matched to skills demand in the labour market
- Matching– what is the impact of the skills-job match on economic performance
- Outcomes– ultimately how do skills impact workforce, economic and social outcomes
 Interactions between the different components and skill indicators in the conceptual framework can be used to map out skilling investment and strategies to raise the effectiveness of interventions at a specific level (regional/state/local etc) or with a specific focus. For instance, a strong correlation exists between the domains of skills acquisition and outcomes.iii Wage-premium, which is a key indicator of economic outcome, shows a negative correlation with a highly skilled workforce or those with higher educational attainment if the same is not counteracted with a corresponding increase in demand for those skills. That is to say, if there is an over-supply of highly skilled individuals without an equal demand for those skills, other things being equal, this drives down wages. Our take on this is that there often lies a danger in mass skilling initiatives without due consideration to the demand side. This results in massive inefficiencies. Especially in India, industry participation (which is key to balancing the demand and supply of skills and jobs) is particularly low at the strategy and design level of skilling programmes.
All contextual factors affecting the health of a nation’s skills are captured by the WISE framework, such as GDP, jobs growth, unemployment, population, employment in the formal and informal sectors, self-employment, literacy rate, educational attainment and enrolment ratios, status of vocational skills, population participation in apprenticeships and TVET. The data further drills down into specifics of how skills are affected by wages, profession, gender parity, local sectoral demand etc.
Taking timely cognizance of such data can greatly strengthen the focus of skilling efforts where needed. Case in point, as explored in our blog Why Integrating TVET Into Mainstream Education is a High Priority, in higher education, India’s enrolment rate stands at 23%, as against about 87% in the US, 57% in the UK and 39% in China.[v] Dropout rate from formal education peaks at the secondary level (class IX-X at 17%, as compared to 4% in elementary school (class I-VIII) and 2% in upper secondary school (class XI-XII).[vi] Hence we had suggested vocational training to be introduced at an earlier stage in the schooling system by lowering the entry point to vocational courses for youth who have not completed secondary education. This step has the potential to capture youth at a crucial stage by offering them an alternative employment lifeline lest they find themselves in the NEET (youth not in employment, education or training) category.
Closer to Local Situations
Regional/local mapping of skilling interventions with key local skill indicators are particularly useful to focus efforts to local conditions. Hence adapting the skill indicators framework to local parameters such as local sectoral needs, local employment/unemployment statistics, local skill levels, local industry demand etc can reap much greater benefits than applying generalised approaches, objectives and outcome measures of national schemes.
We looked at the importance of targeted interventions based on skill indicators in our posts Key Markers in Skills Training for Policy Makers – Part I and Part II .
Dearth of Information
The problem is not all countries have key skill indicators. Even if they do it may not be a comprehensive dataset or available for all years. India in particular suffers from a dearth of reliable datasets when it comes to regional or local information. The absence of reliable data is a pressing problem challenging policymakers and other stakeholders to often shoot in the dark when it comes to skilling initiatives. What works for one state, one region, one sector, or one section of workers may be completely different for another.
Earlier in mid-2018 the government announced plans to create a central data portal to bring various ministries on board to converge their skilling programmes. A national skills portal when ready would have skilling data from all central ministries, states and corporates. The Ministry of Skill Development and Entrepreneurship with assistance from the World Bank was charged with gathering skilling data across gender, sectors, socio-economic status and geographical locations to build a map of demand and supply of skills. The objective of the national skills portal would be to help close the massive mismatch between existing skills and industry demand. The progress of this skill indicators portal is currently unknown.
Another suggestion is a National Employment Policy (NEP)[vii] which would involve the creation of a comprehensive Labour Market Information system providing real-time reliable data for targeted policy interventions for skilling and jobs creation in different sectors and regions. Once skill indicators are put in place, states can be indexed based on a ranking system across various skilling parameters.
Benefits
Skill development indicators are extremely valuable when it comes to skills-jobs matching, which is ultimately a key definer of a skilling programme and its impact on the economy. Effective matching of skills with jobs in demand also has a positive impact on wages as workers whose skills equal industry demand generally command a wage premium over skilling programmes which are merely supply oriented. Skill development indicators would also help different states chalk out their own skilling programmes based on their past performance and future requirements. Another advantage is the sharing of best practice and data across different states and sectors to strategise on future optimisation of skills and jobs matching. Overall return on investment in skilling and training is higher in countries where skilling ambitions are based on skill development indicators.
References
[i] India Skills Report 2018, Wheebox, PeopleStrong, Confederation of Indian Industry
[ii] Fifth Annual Employment – Unemployment Survey (2015-16), Ministry of Labour and Employment, GoI
[iii] World Indicators of Skills for Employment (WISE) database, Skills for Employment, Global Public-Private Knowledge Sharing Platform
[iv] World Indicators of Skills for Employment (WISE): new OECD database, Oct 8, 2015, OECD Skills and Work Blog
[v] Trends in school enrolment and dropout levels, Oct 02 2017, LiveMint
[vi] Educational Statistics at a Glance, 2018, Department of School Education & Literacy, MoHRD
[vii] National Employment Policy for India: A Perspective, Sunita Sanghi, Dr. Sakshi Khurana, NITI Aayog