The Indian workforce is highly stratified and segmented. A strong vetting system of key indicators of skills training is tremendously valuable for policymakers when formulating effective training programmes catered to specific population needs. Part 1 of this essay talks about the urban-rural differences, employment and state wise split. In Part II, we will examine the degree of formality in apprenticeship as well as NATS split and ITI split.
Targeted Skills Training
The ILO describes skills needs assessment and anticipation[i] as ‘activities to assess future skills needs in the labour market in a strategic way, using consistent and systematic methods’. Such an assessment at regional, national and/or sectoral level can yield data on key labour market markers about current and future needs, gaps, trends and imbalances.
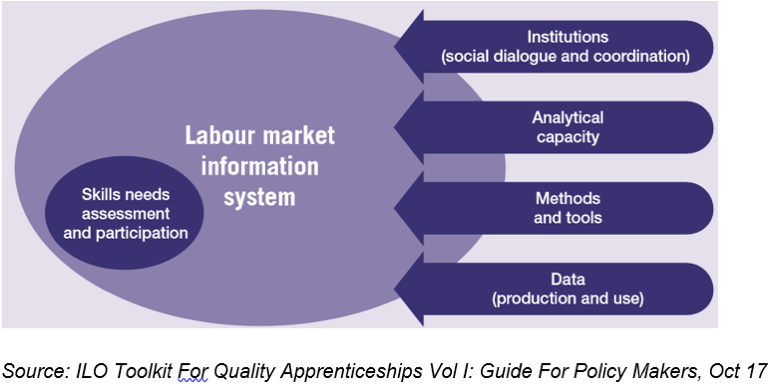
To raise the effectiveness and impact of skills training, courses offered by ITIs, ITCs, polytechnics etc should mirror the specific employment opportunities in a particular area (urban/rural), state or region. This should be a continuous dedicated exercise at the policy level to monitor and identify workforce dynamics. In time, trends in job opportunities for a particular state or region will allow for efficient forecasting and demand planning enabling training providers to channel funds and resources towards capacity building where it is needed. This sort of targeted skills training does away with a blanket approach where a catalogue of courses is offered with no link to actual demand or areas of skill shortage. For targeted interventions, entities such as state governments, regional training boards along with training providers should be working in partnership towards, at the very least:
- To gather data of job potential in different sectors
- To examine skill shortages
- To forecast work opportunities according to type of work (seasonal, regular, skilled, sem-skilled, formal, informal etc)
We attempt to showcase a few key differences in vocational and skills training attainment, availability, and employment differences from an urban-rural, state and regional split.
Urban Rural Differences
Rural India makes up 71.2 percent of the country’s population. Hence, skills training initiatives, reach and impact on rural youth forms the backbone of India’s lofty ambition to become the ‘Skill Capital of the World’.
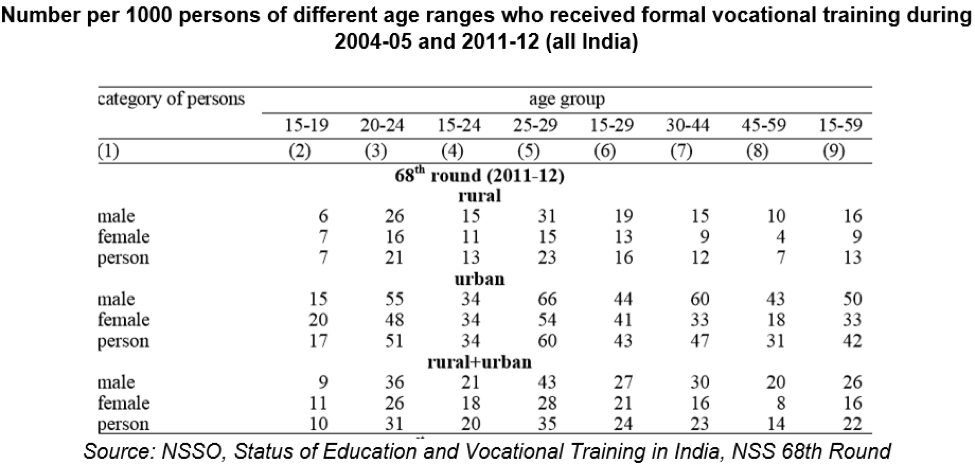
The latest NSS (68th) report [ii]on the ‘Status of Education and Vocational Training in India’ throws up some interesting figures:
- Only 2.4 percent of individuals age 15 and above had technical degrees or diplomas or certificates. The proportion was 1.1 per cent in rural areas and 5.5 per cent in urban areas.
- About 27 percent in rural areas and 26.4 percent in urban areas stated ‘education not considered necessary’ for never attending any educational institution.
- All India, between the ages of 15-59 years, only about 2.2 percent reported to have received formal vocational training, of which 2.5 percent belonged to rural India, and 8.8 percent to urban India.
The drop-out rate from secondary education (class IX-X) is the highest across the schooling system with youth leaving formal education with no skills and no qualifications. The NSS report similarly finds the proportion of persons who received formal vocational training was the highest in the age-group 25-29; 2.3 percent in rural areas and 6 percent in urban areas; whereas, it’s the lowest in the 15-19 age group. Capturing youth at and below the secondary level for skills training is one of the biggest challenges the country faces.
This is especially paramount to India’s skilling ambitions given that nearly 50 percent of rural households stated self-employment as their primary source of income, 34.5 percent from casual labour and the rest from regular wages/salary. This was reversed for urban households where a regular salaried job was the main income generator (41.7 percent), followed by self-employment (35.3 percent) and the remaining from casual labour.i Skills training and entrepreneurship are two sides of the same coin. To strengthen the capabilities of India’s vast rural entrepreneurs, and bring them to the level of market competitiveness, skill building is the way to go.
Also read:
An apprenticeship toolkit for employers
Building an appetite for skill-based employment in the Restaurant and Food sector
Employment Split
The State of India Working 2018[iii] report found open unemployment-where there are no jobs matching education or skills- highest in the northern states of Rajasthan, Uttar Pradesh, Uttarakhand, Bihar, Chhattisgarh, Punjab, and, Jammu and Kashmir with rates ranging from 6-30 percent (in 2015).
The Fifth Annual Employment – Unemployment Survey (2015-16)[iv] pegs unemployment in the country at 5.0 percent. With less than a fifth of the country’s workforce in regular employment, and close to 50 percent self-employed, state-wise and regional employment figures are key indicators of skill gaps and potential for job creation through appropriate skills training specific to those regions.
- Arunachal Pradesh has the highest number for self-employment at 81.2 percent compared to the lowest 15.7 percent in Puducherry. All Southern states except Karnataka have high levels of casual labour with Andhra Pradesh at the highest at 48.5 percent followed by Tamil Nadu (47.3 percent), Kerala and West Bengal (43.8 percent).
- At 54.2 percent, Chandigarh has the highest number employed on a regular wage while Bihar has the lowest at 9.7 percent.
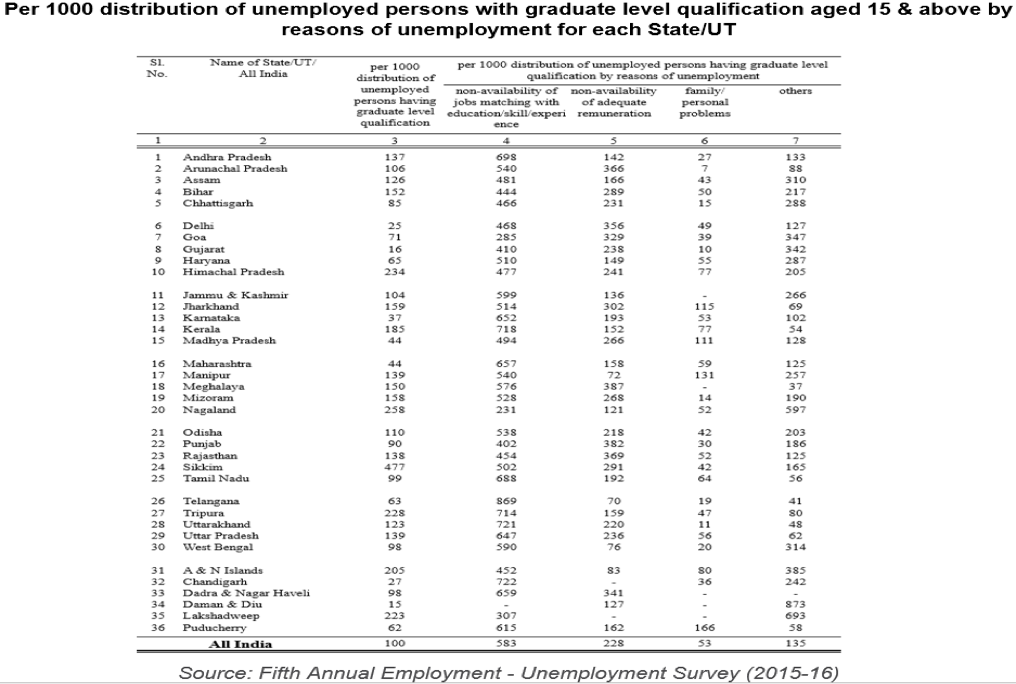
- A serious cause for worry, 58.3 percent (all India) of unemployed graduates cited non-availability of jobs matching with education, skill and experience as the chief reason for unemployment. For every 1000 unemployed graduate, Telangana topped the list at 869, followed by Chandigarh (722), Uttarakhand and Tripura (721, 714), followed by Andhra Pradesh, Tamil Nadu and Maharashtra. From a regional split, the South registers the highest mismatch (70%), trailed by the North, East and West (between 55.5-50.27 percent).
State-wise Sectoral Split
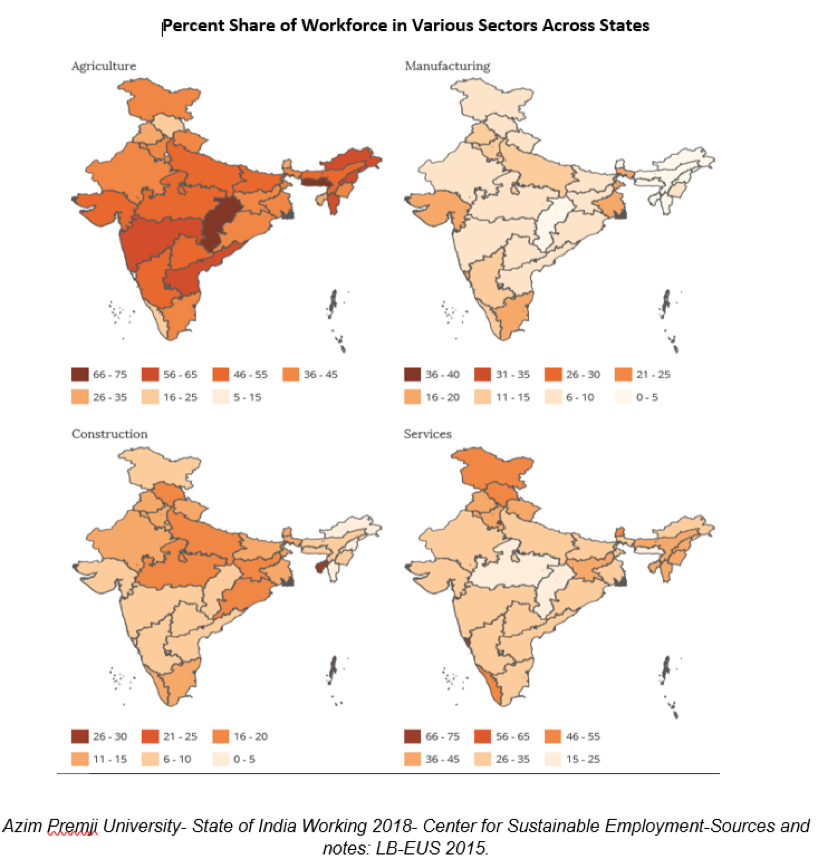
The State of India Working 2018 report has found that West Bengal has a large workforce in manufacturing, similar to Gujarat and Tamil Nadu, due to a large informal manufacturing sector in West Bengal.
The report further found Kerala, Jammu and Kashmir, Himachal Pradesh, and Goa leading in service sector workforce engagement. A wide differential was found in the make-up of workforce in construction across states, which again highlights the importance of closely examining the more in-demand employment generation opportunities specific to a state or region to match skills training in those areas.
Odisha, Bihar, UP, MP, Kerala and Rajasthan register construction as the principal activity by almost 20 percent of their workforce, which drops to 5 percent for Maharashtra. There are also vast differences in a state’s workforce across the four major sectors of agriculture, manufacturing, construction, and services. This reiterates the point that skill building initiatives and programmes at the policy level requires a much more focused modus-operandi if skills are to match jobs.
Please do remember to also go through the Part II and concluding part of this article.
References
i. ILO Toolkit for Quality Apprenticeships Volume I: Guide for Policy Makers, October 2018
ii. Status of Education & Vocational Training in India, NSS 68th Round, June 2011- July 2012, National Sample Survey Office, Ministry of Statistics & Programme Implementation
iii. State of India Working 2018, Azim Premji University, Center for Sustainable Employment
iv. Fifth Annual Employment – Unemployment Survey (2015-16), Ministry of Labour and Employment, GoI